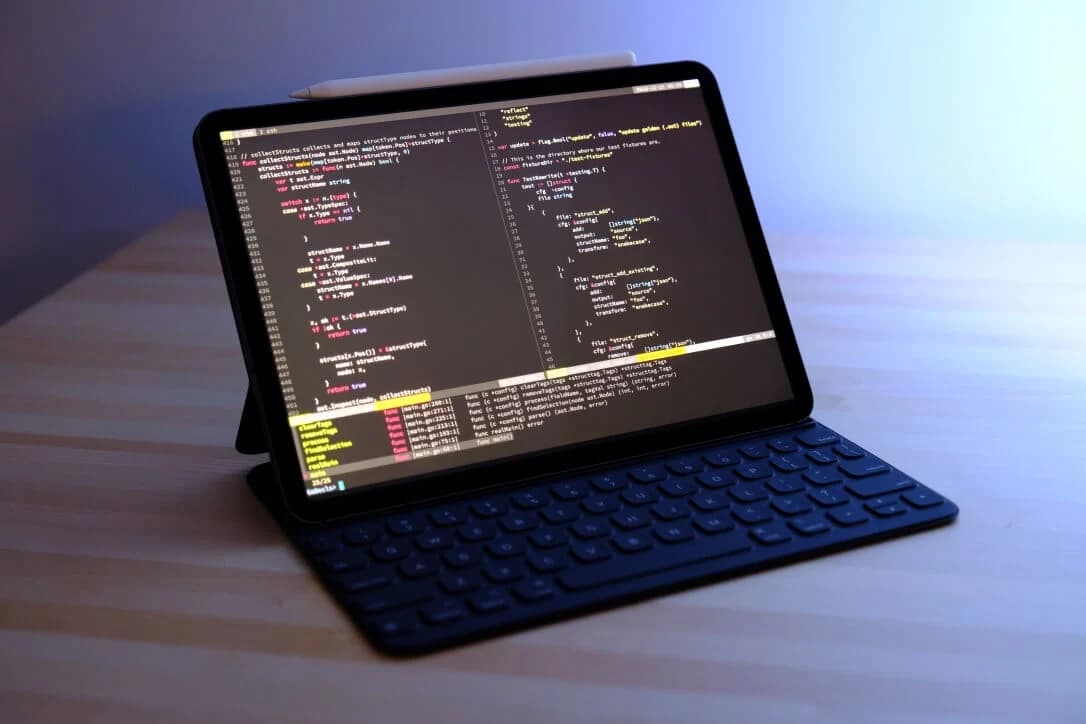
Introduction to Data Visualization
Goal: Give a brief idea of data visualization and introduce Tableau 10
Objectives:
- Identify the prerequisites, goal, objectives, methodology, material, and agenda for the course
- Discuss the basic of Data Visualization
- Get a brief idea about Tableau online course, establish a connection with the dataset, perform Joins operation on the data set
Topics:
- Data Visualization
- Introducing Tableau 10.0
- Establishing Connection
- Joins and Union
- Data Blending
Hands-On:
- Establishing the connection with the files, Introducing important UI components (ShowMe, Fit Axes)
- Perform Cross Joins between the dataset
Visual Analytics
Goal: Learn to manage your dataset and analyze things visually with the help of Marks Card and “highlighting” feature.
Objectives:
- Manage extracts and metadata (by creating hierarchy and folders
- Describe what is Visual Analytics, why to use it, and it’s various scopes
- Explain aggregating and disaggregating data and how to implement data granularity using marks card on aggregated data
- Describe what is highlighting, with the help of a use-case
- Illustrate basic graphs including a bar graph, line graph, pie chart, dual axis graph, an area graph with dual axis
Topics:
- Managing Extracts
- Managing Metadata
- Visual Analytics
- Data Granularity using Marks Card
- Highlighting
- Introduction to basic graphs
Hands-On:
- Creating Extracts, Hierarchy, Folders
- All the features of Marks Card Shelve with use case provided
- Power of Highlighting in the visualization using the Use-case
- How to create basic graphs in Tableau10.x
Visual Analytics in Depth I
Goal: This module presents to you the granular content of Visual analytics, covering various techniques to perform sorting, filtering, and grouping on the dataset.
Objectives:
- Perform sorting techniques including quicksort, using measures, using header and legend, and sorting using pill with the help of a use case.
- Master yourself into various filtering techniques such as Parametrized filtering, Quick Filter, Context Filter. Learn about various filtering option available with the help of use case and different scenarios.
- Illustrate grouping using data-window, visual grouping, and Calculated Grouping (Static and Dynamic).
- Illustrate some more graphical visualization including Heat Map, Circle Plot, Scatter Plot, and TreeMaps.
Topics:
- Sorting.
- Filtering.
- Grouping
- Graphical Visualization
Hands-On:
- Quick Sort, Sorting using measure, Sorting using header and legends, sorting using the pill(use-case).
- Filtering Use cases covering different options (General, Wildcard, Conditional).
- Interactive Filter, Quick Filter, Context Filter.
- Grouping using Data Window, Visual Grouping, Calculated Grouping (Static and Dynamic).
Visual Analytics in Depth
Goal: This module presents to you Visual analytics in a more granular manner thereby letting you to dive deep into the content. It covers various advanced techniques for analyzing data including, forecasting, trend lines, reference lines, clustering, parametrized concepts, and creating sets.
Objectives:
- Explain the basic concepts of sets followed by Creating sets using Marks Card, computation sets and combined sets
- Describe the concepts of forecasting with the help of Forecasting problem as a use-case
- Discuss the basic concept of clustering in Tableau
- Add Trendlines and reference line to your visualization
- Discuss Parameter in depth using Sets and Filter
Topics:
- Sets
- Forecasting
- Clustering
- Trend Lines.
- Reference Lines.
- Parameters
Hands-On:
- Create sets using marks card, Computation sets, and Combined sets
- Forecasting using Precise Range
- Methods of clustering
- Adding trend line and the reference line (along with various options available for them)
- Parameter using sets and filter
Dashboard and stories
Goal: Learn all about Dashboards and Stories in Tableau.
Objectives:
- Describe the basic concepts of the Dashboard and its UI.
- Build a dashboard by adding sheets and object into it
- Modify the view and layout.
- Edit your dashboard, how it should appear on phones or tablets.
- Create an interactive dashboard using actions (filter, highlighting, URL).
- Create stories for your Visualization and Dashboards.
Topics:
- Introduction to the Dashboard.
- Creating a Dashboard Layout.
- Designing Dashboard for Devices.
- Dashboard Interaction - Using Action.
- Introduction to Stony Point.
Hands-On:
- Creating a Dashboard and learning its UI component.
- Changing the layout of the dashboard.
- Using Device Designer to create a dashboard for devices.
- Create an interactive dashboard using actions (Filter, Highlight, URL).
- Creating the story with a dashboard.
Mapping
Goal: This module helps you in understanding mapping in detail, editing unrecognized and ambiguous location, and creating customized geocoding. Learn about polygon map and Web Mapping Service, and finally, add background images with self-generated coordinates.
Objectives:
- Map the coordinates on the map, plot geographic data, and use a layered view to get the street view of the area.
- Edit the ambiguous and unrecognized location plotted on the map.
- Customize territory on a polygon map.
- Connect to the WMS Server, use a WMS background map and saving it.
- Add a background image and generate its coordinate and plot the points.
Topics:
- Introduction to Maps.
- Editing Unrecognized Locations.
- Custom Geocoding.
- Polygon Maps.
- Web Mapping Services.
- Background Images.
Hands-On:
- Plot the coordinate points on the map, plotting the geographic data, Street View using the layered view.
- Editing Unrecognized and ambiguous location
- Custom Geocoding.
- Creating a customs territory, building a polygon map.
- Establishing a connection with the WMS Server a WMS background map and saving it.
- Adding a background image and generate coordinates and finally plotting points.
Calculation
Goal: This module will help you in creating basic calculations including string manipulation, basic arithmetic calculations, date math, logic statements, and quick table calculations. Along with this, you will be also introduced to LOD expressions with the help of use cases.
Objectives:
- Perform Calculations using various types of functions such as Number, String, Date, Logical, and Aggregate.
- In addition, you will get to know about Quick Table Calculation.
- Cover the following LOD expressions – Fixed, Included, and Excluded.
Topics:
- Introduction to Calculation: Number Functions, String Functions, Date Functions, Logical Functions, Aggregate Functions.
- Introduction to Table Calculation.
- Introduction to LOD expression: Fixed LOD, Included LOD, Excluded LOD
Hands-On:
- All Functions (Number, String, Date, Logical, Aggregate)
- Table Calculation.
- LOD expressions.
Charts
Goal: Plot various types of Charts using Tableau 10 and have extensive hands-on on industry use cases.
Topics :
- Box and Whisker's Plots
- Gantt Charts
- Waterfall Charts
- Pareto Charts
- Control Charts
- Funnel Charts
Hands-On:
- Extensive hands-on on the above topics
Integrating Tableau with R and Hadoop
Goal: This module introduces you to the concept of Big Data, Hadoop, and R. You discuss the integration between Tableau and R and finally publish your workbook on Tableau Server.
Objectives:
- You will know the basics of Big Data, Hadoop, and R.
- You will discuss the integration between Hadoop and R and will integrate R with Tableau.
- In addition, you will get to publish your workbook on Tableau Server.
Topics:
- Introduction to Big Data
- Introduction to Hadoop
- Introduction to R
- Integration among R and Hadoop
- Calculating measure using R
- Integrating Tableau with R
- Integrated Visualization using Tableau
Hands-On:
- Installing Reserve package in R
- Integrating Tableau and R
- Publishing your workbook on Tableau Server.